

Dashboard
On the dashboard, you can get a quick overview of how your upsells are doing. We show a rolling 30 Day history here including number of active offers, offer views, engagement and true conversions.
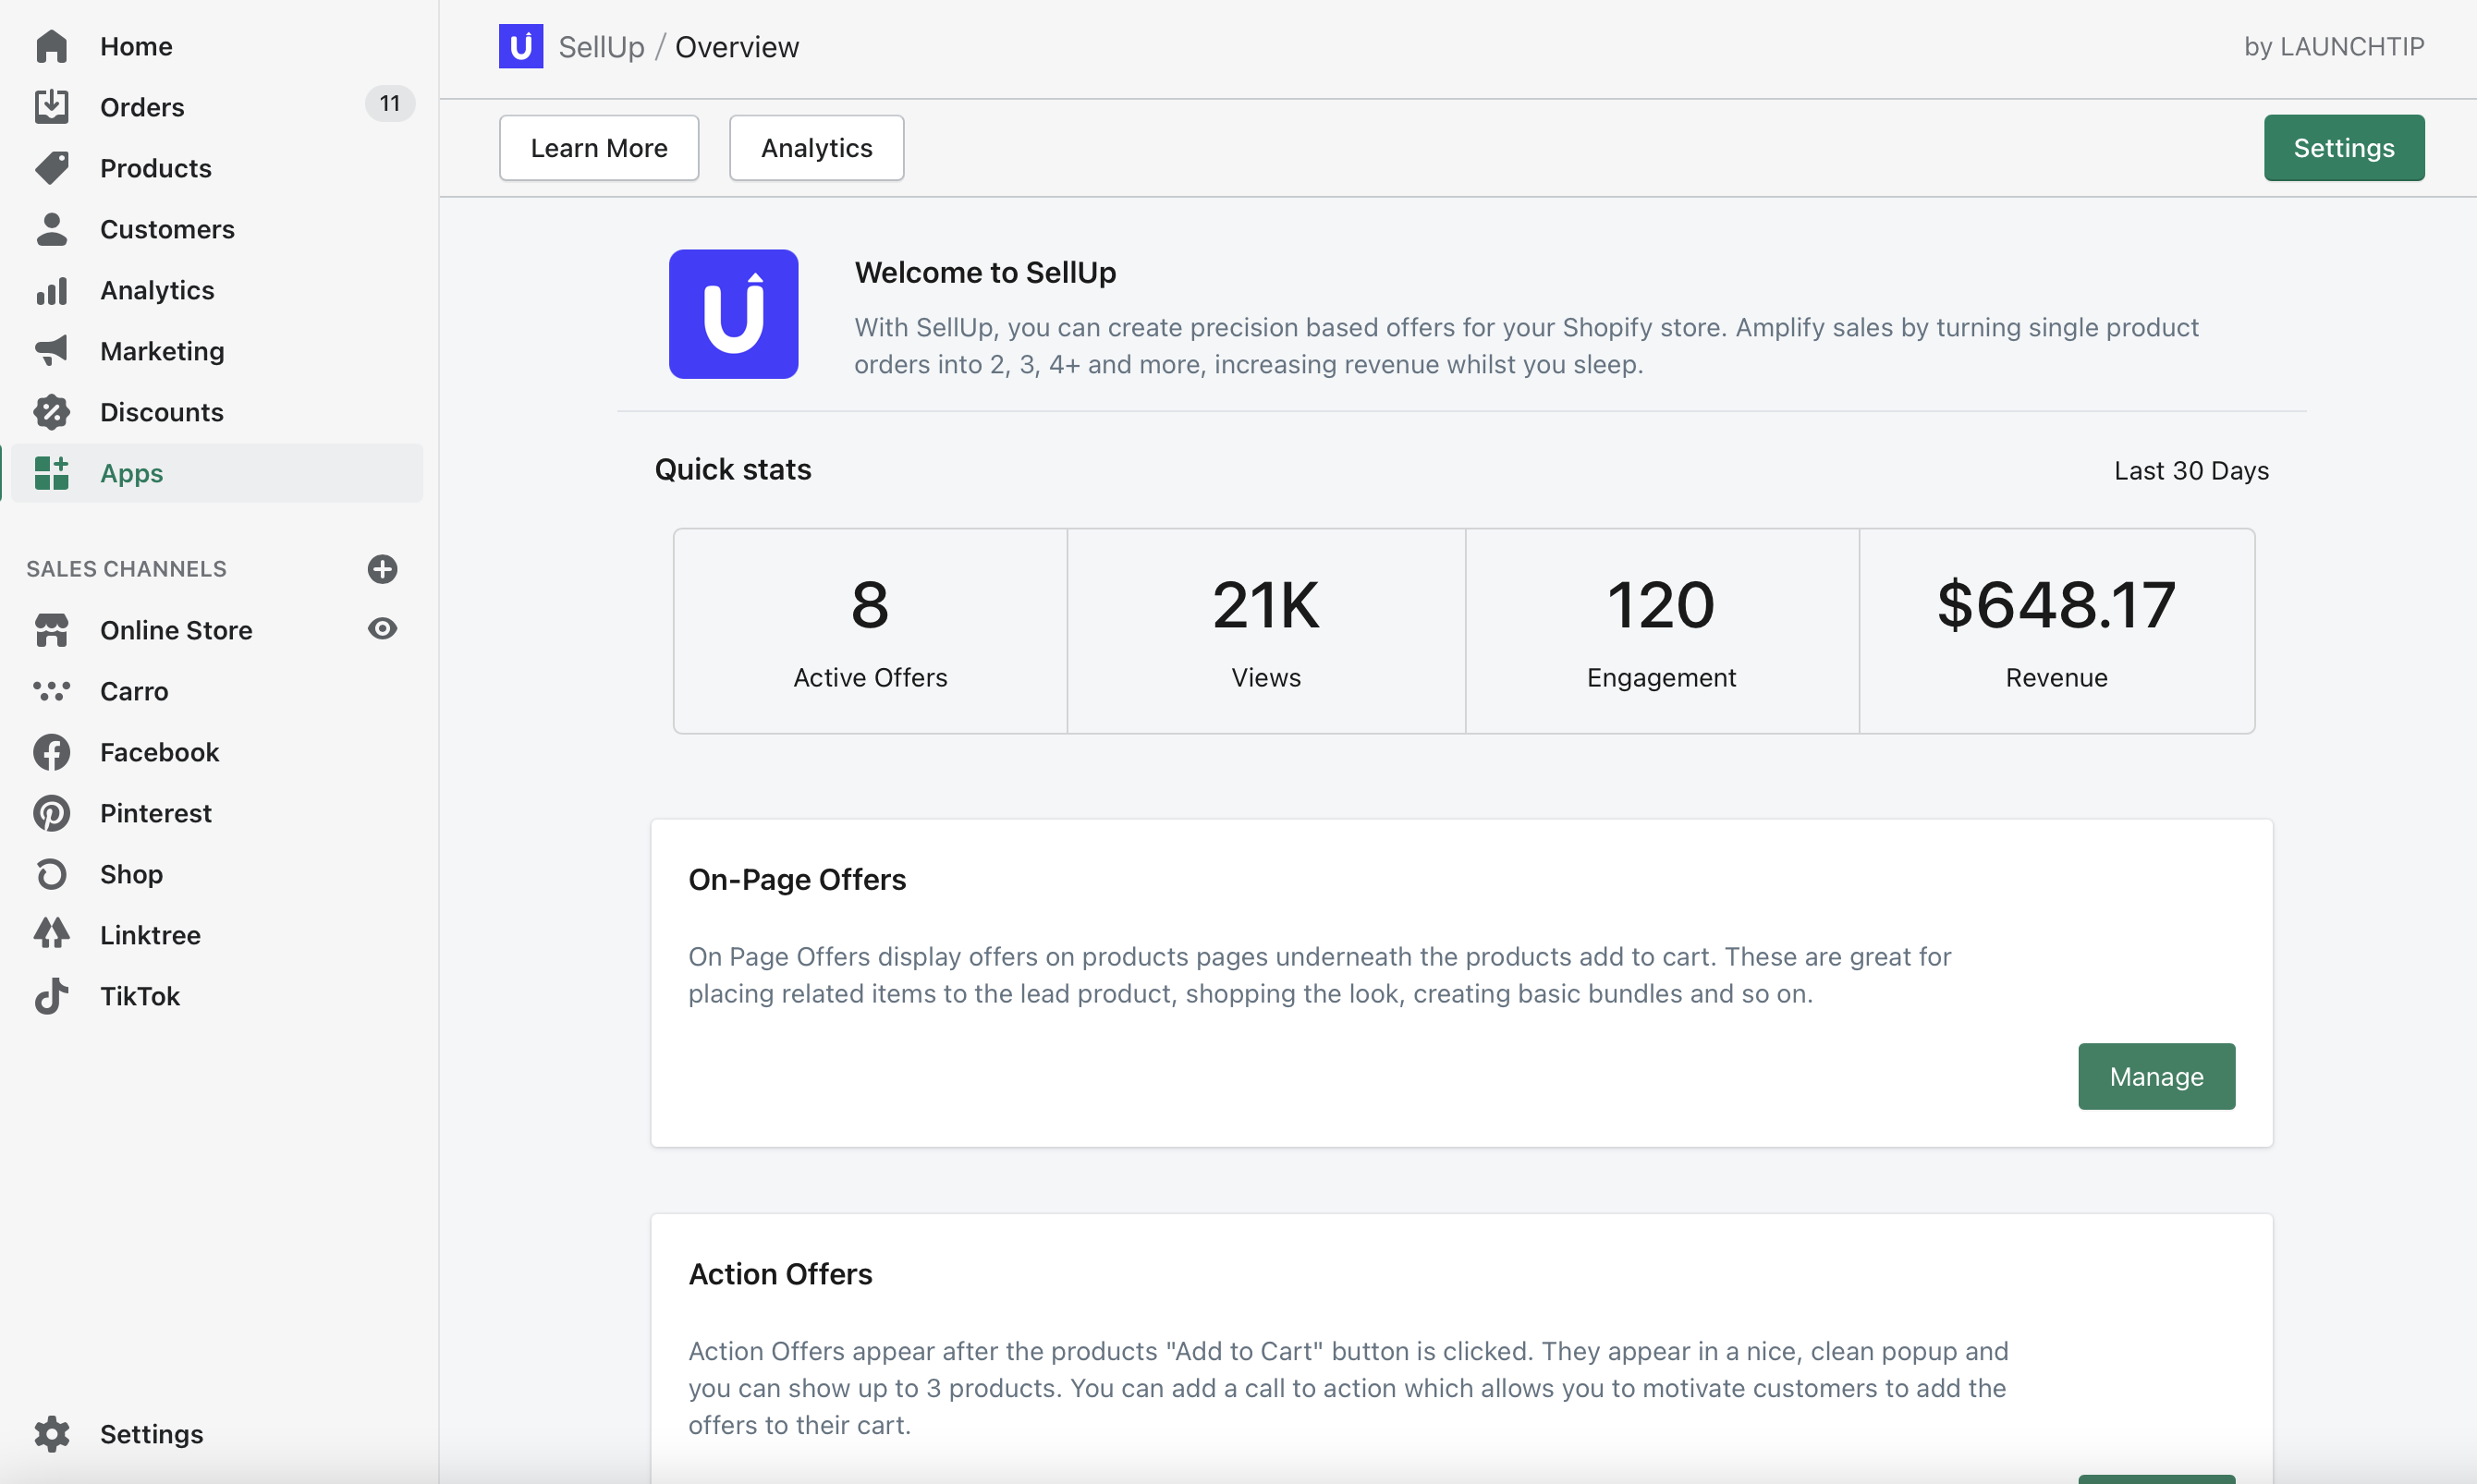
SellUp correctly reports actual sales from upsells shown to your customers. More importantly, SellUp only attributes the upsold products and not the whole basket total. We believe in transparency when it comes to relaying metrics to you. Some other providers report the total basket value which we believe to be misleading in accounting for the true amount that was gained from the upsell.
Analytics
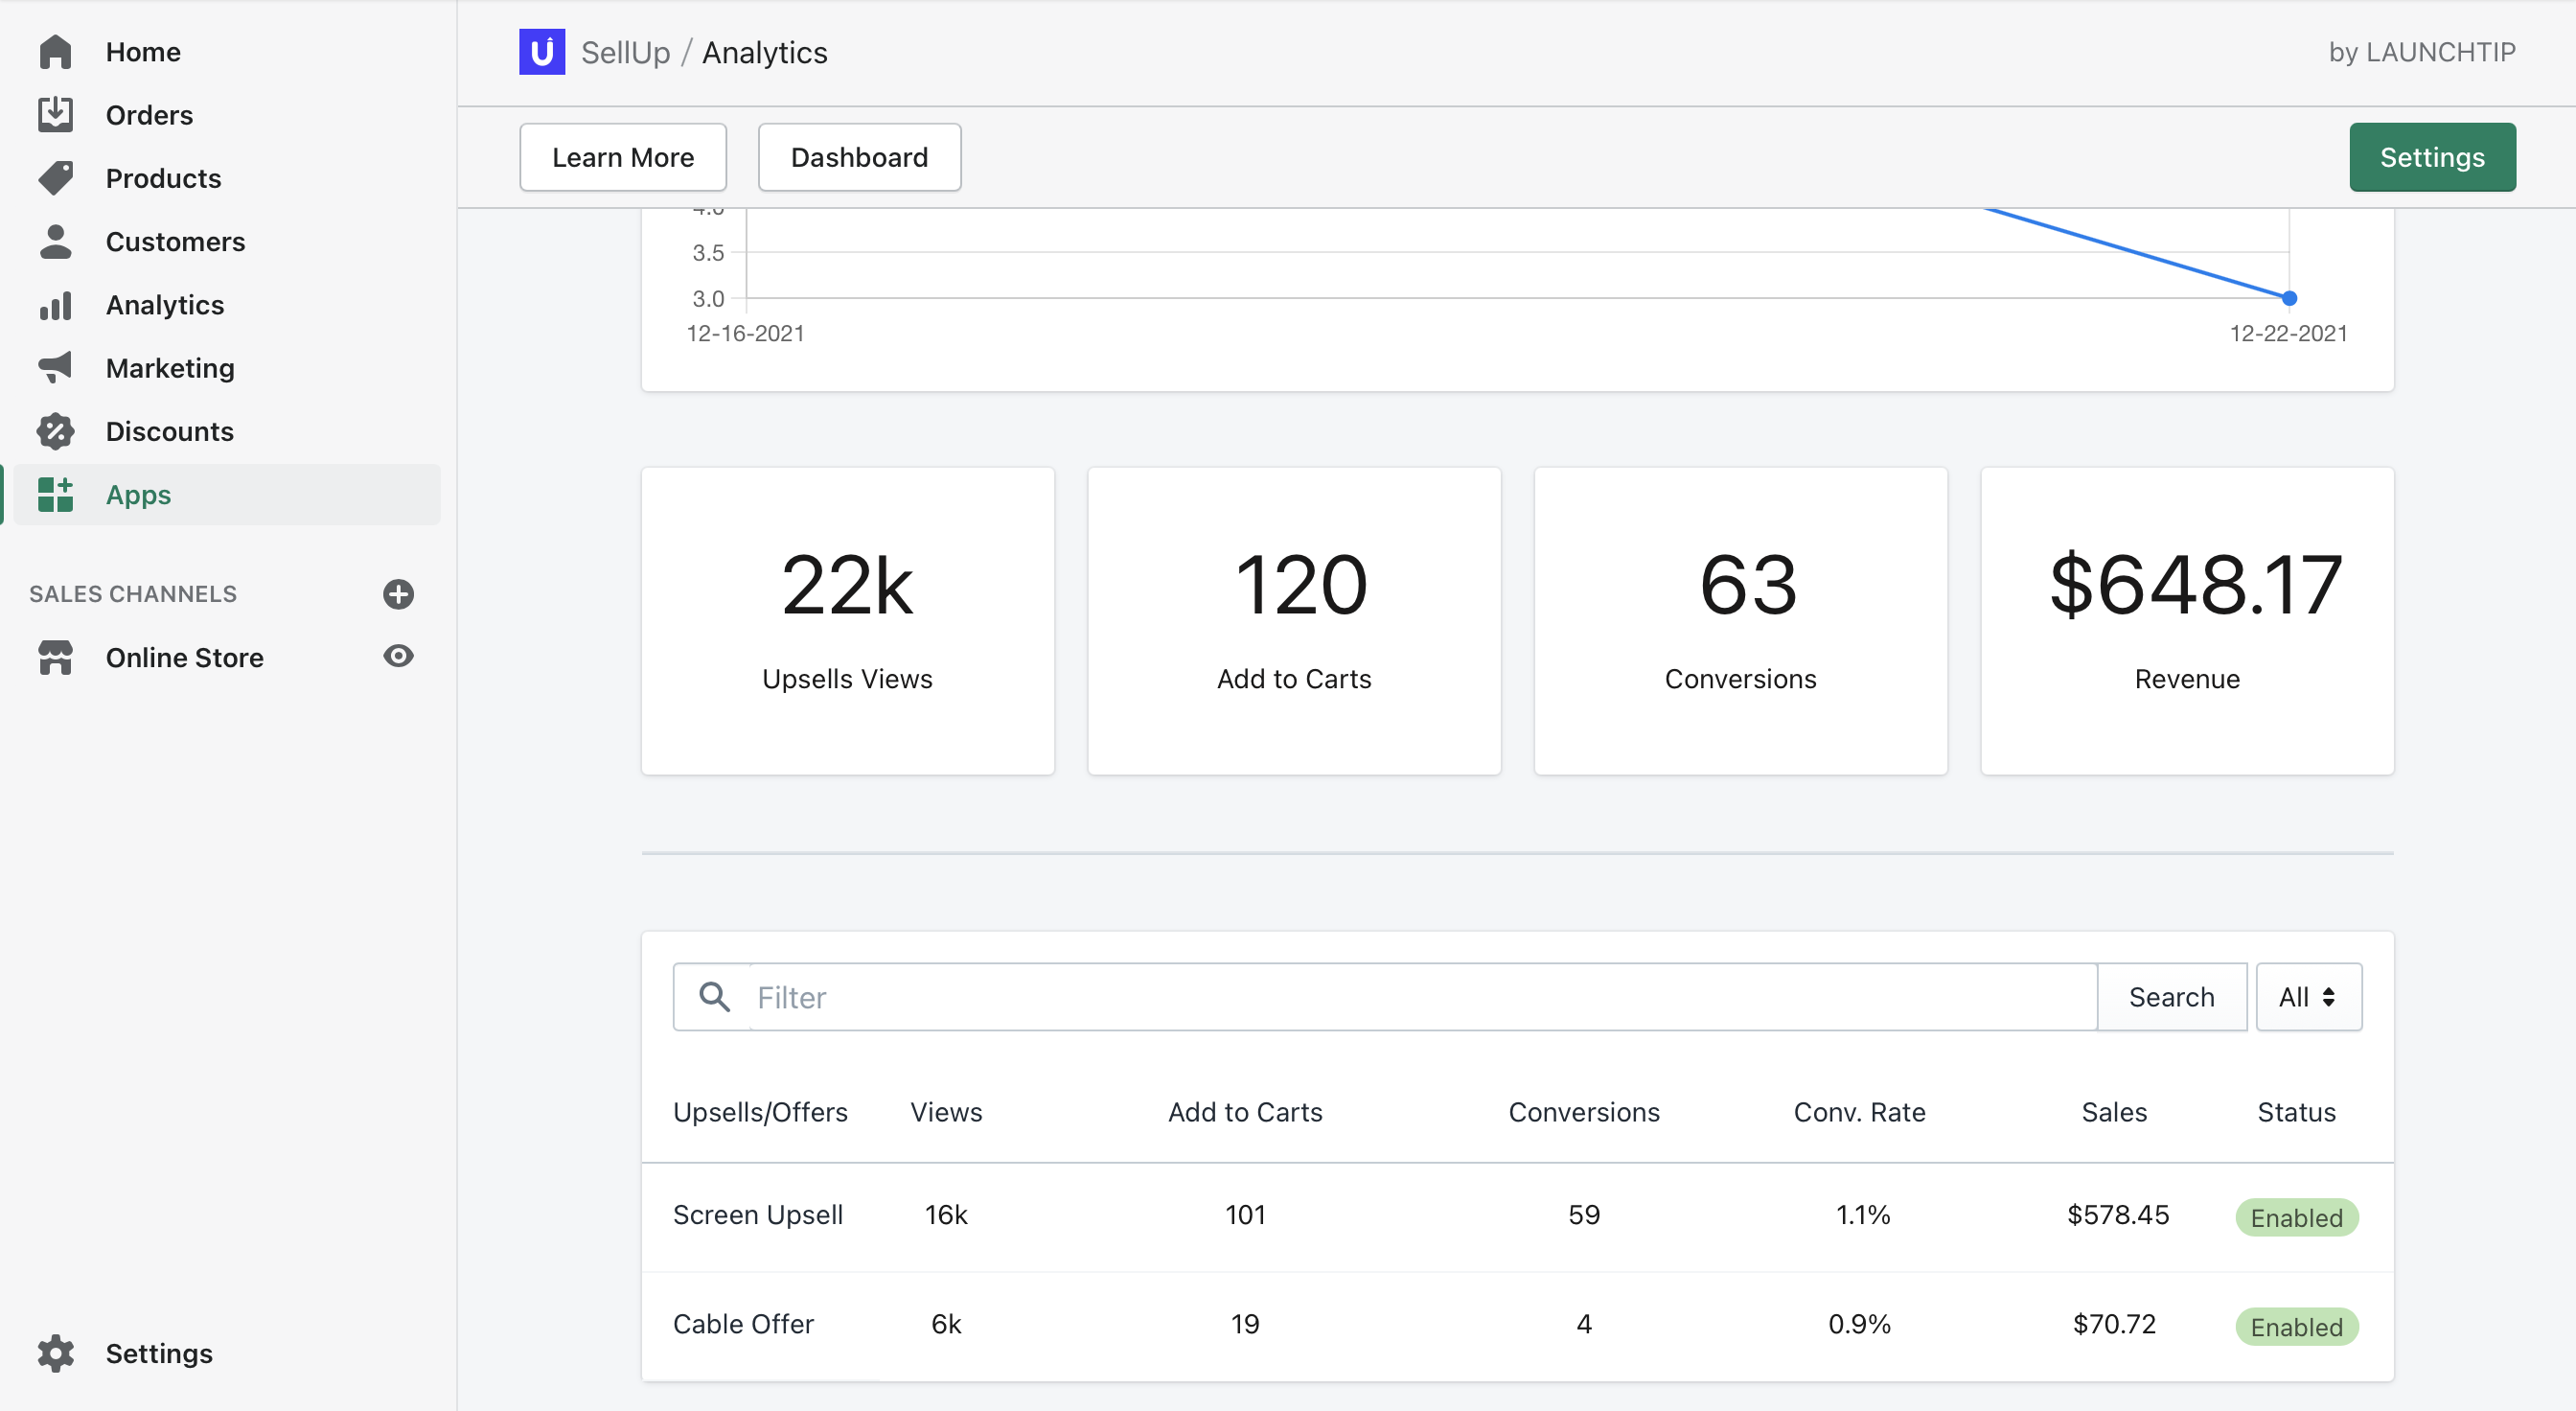
SellUp includes an analytics suite. This can be accessed by clicking the Analytics button in the top bar.
The main page displays an overview of all enabled and disabled analytics including all stats in the given time frame.
You can view analytics from a specific upsell offer by clicking it from the list. This will load a similar interface but will show details from that offer only.
For merchants on legacy pricing, the Analytics suite requires usage based charging to be active. This is part of the conversion tracking. If you are on legacy pricing, you will be greeted with the chance to move your plan over to the usage based plan to get access to the Analytics suite when you access Analytics for the first time.