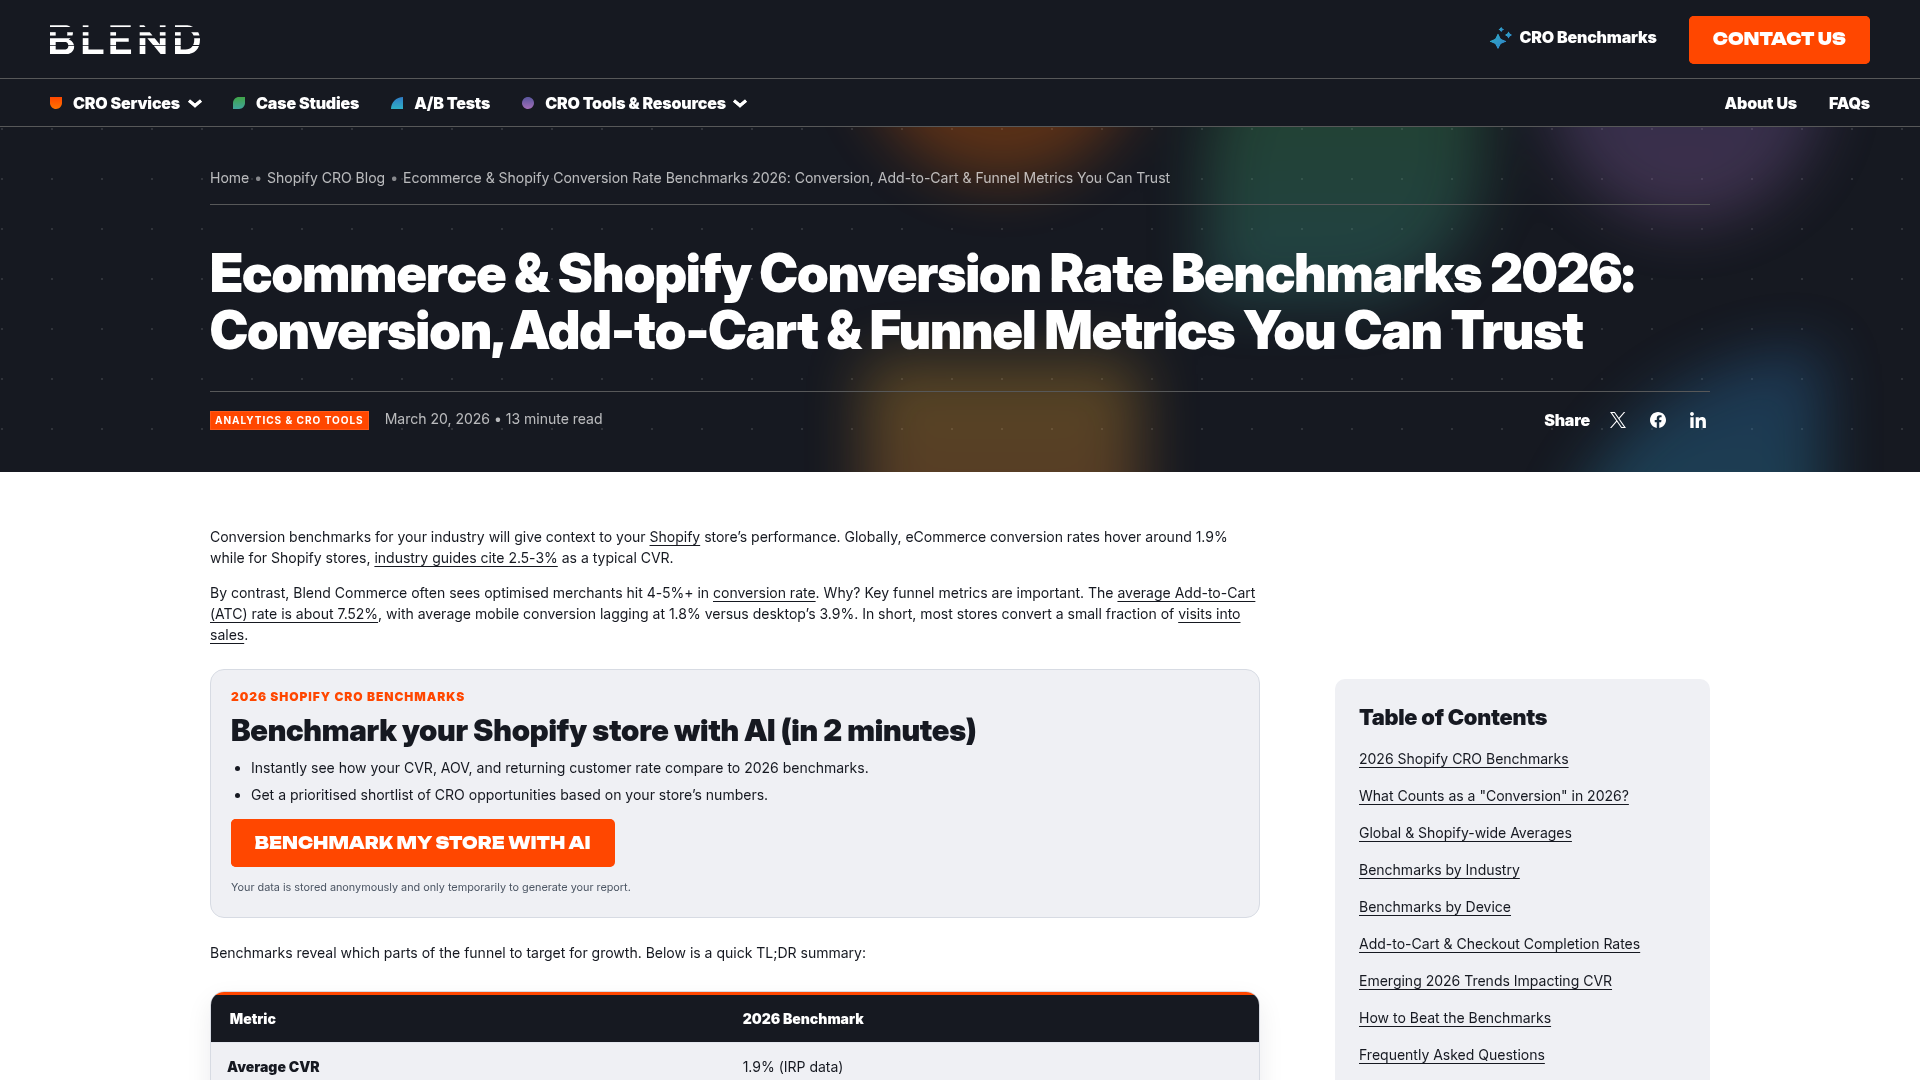
Shopify conversion rate statistics 2026 show one clear pattern: there is no single benchmark that fits every store. In 2026, the overall Shopify average sits around 1.4% to 1.8%, but industry averages vary widely, from roughly 1.7% in jewelry to 4.2% to 6.22% in food and beverage.
As a Shopify app developer, I have learned that merchants often compare themselves to the wrong number. A 2.4% conversion rate can be weak for beauty, solid for home and garden, and genuinely strong for a higher-ticket electronics store. The benchmark only becomes useful when you compare it against your category, your traffic mix, your device split, and your price point.
In this guide, I will break down the latest Shopify conversion rate benchmarks by industry for 2026, explain what a good conversion rate actually looks like, and show you how I would analyze a store if I wanted to improve performance without wasting time on vanity metrics.

What are the latest Shopify conversion rate statistics for 2026?
The latest Shopify conversion rate statistics for 2026 put the platform-wide average at 1.4% to 1.8%. Stores in the top 20% typically convert at 3.2% or higher, and the top 10% often reach 4.7%+.
Those numbers line up with what I keep seeing across Shopify content, merchant discussions, and store audits. They also match a reality I see building apps for merchants: averages are useful, but they hide huge differences in buyer intent, repeat purchase behavior, and mobile checkout friction.
Here are the most useful 2026 numbers to know:
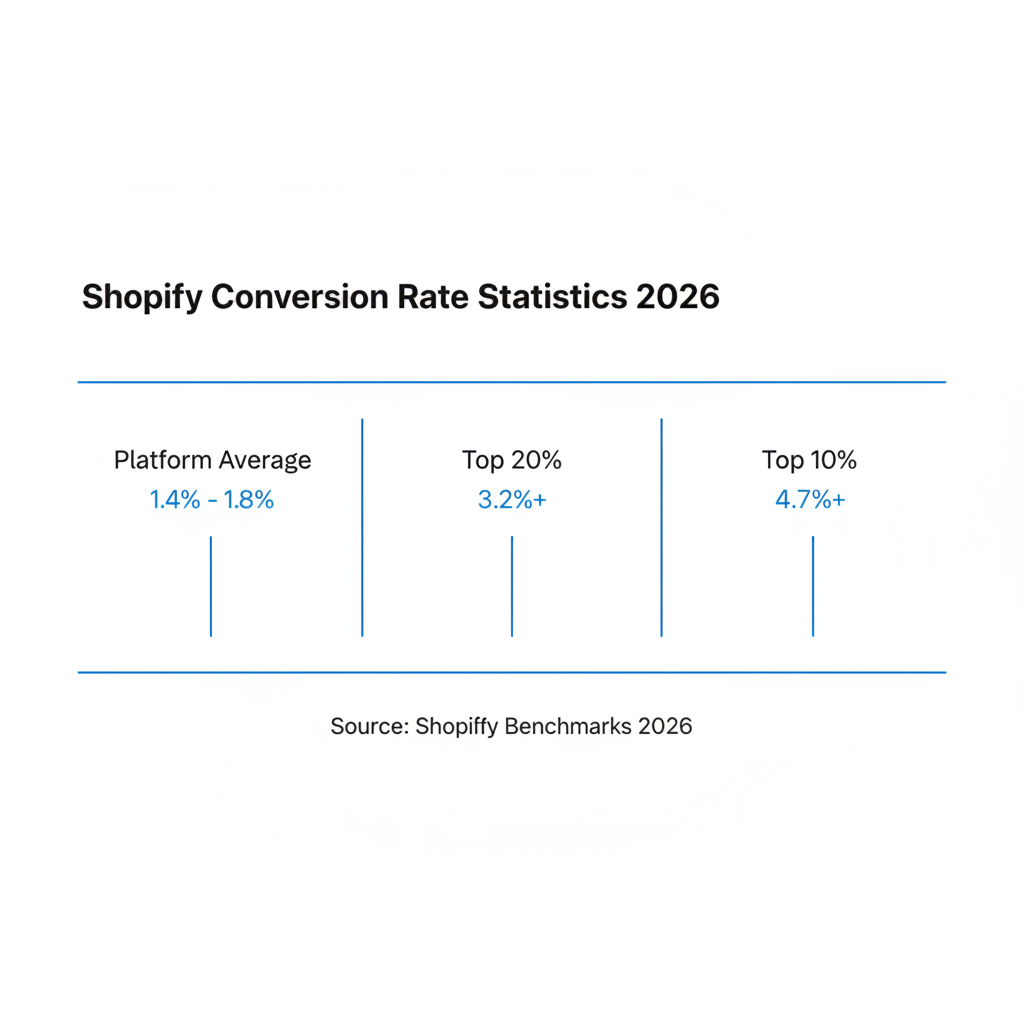
- Overall Shopify average conversion rate: 1.4% to 1.8%
- Good platform-wide rate: 2.5% to 3.5%
- Top 20% of stores: 3.2%+
- Top 10% of stores: 4.7%+
- Desktop average: around 1.8% to 1.9%
- Mobile average: around 1.2% to 1.3%
If you want a broader CRO framework beyond benchmarks, I recommend reading our guide on how to optimize your conversion rate on Shopify. Benchmarks tell you where you stand. Optimization tells you what to fix.
What is a good Shopify conversion rate in 2026?
A good Shopify conversion rate in 2026 is usually 2.5% to 3.5% across the platform. But the better answer is that a good rate is one that beats your industry average and improves profitably over time.
I think a lot of benchmark articles oversimplify this. If you run a replenishable product line like snacks, supplements, or pet consumables, you should expect a higher conversion rate than a store selling engagement rings or premium furniture. The gap is not always a CRO problem. Sometimes it is just the economics of the category.
| Performance Tier | Conversion Rate | How I Would Read It |
|---|---|---|
| Needs attention | Below 1.0% | Usually signals traffic mismatch, weak product pages, trust issues, or checkout friction |
| Average | 1.0% to 1.8% | Common for many Shopify stores, especially newer brands or mixed-quality traffic |
| Good | 1.8% to 3.2% | Healthy range for many stores, but still industry dependent |
| Strong | 3.2% to 4.7% | Often top 20% territory with solid merchandising and checkout experience |
| Excellent | 4.7%+ | Elite performance, usually supported by strong brand trust and high-intent traffic |
One of the biggest mistakes I see is merchants chasing a generic 3% target without checking whether their category, AOV, and traffic quality support it. A better goal is to beat your category median first, then improve add-to-cart rate, checkout completion, and average order value together.

How do Shopify conversion rate benchmarks vary by industry in 2026?
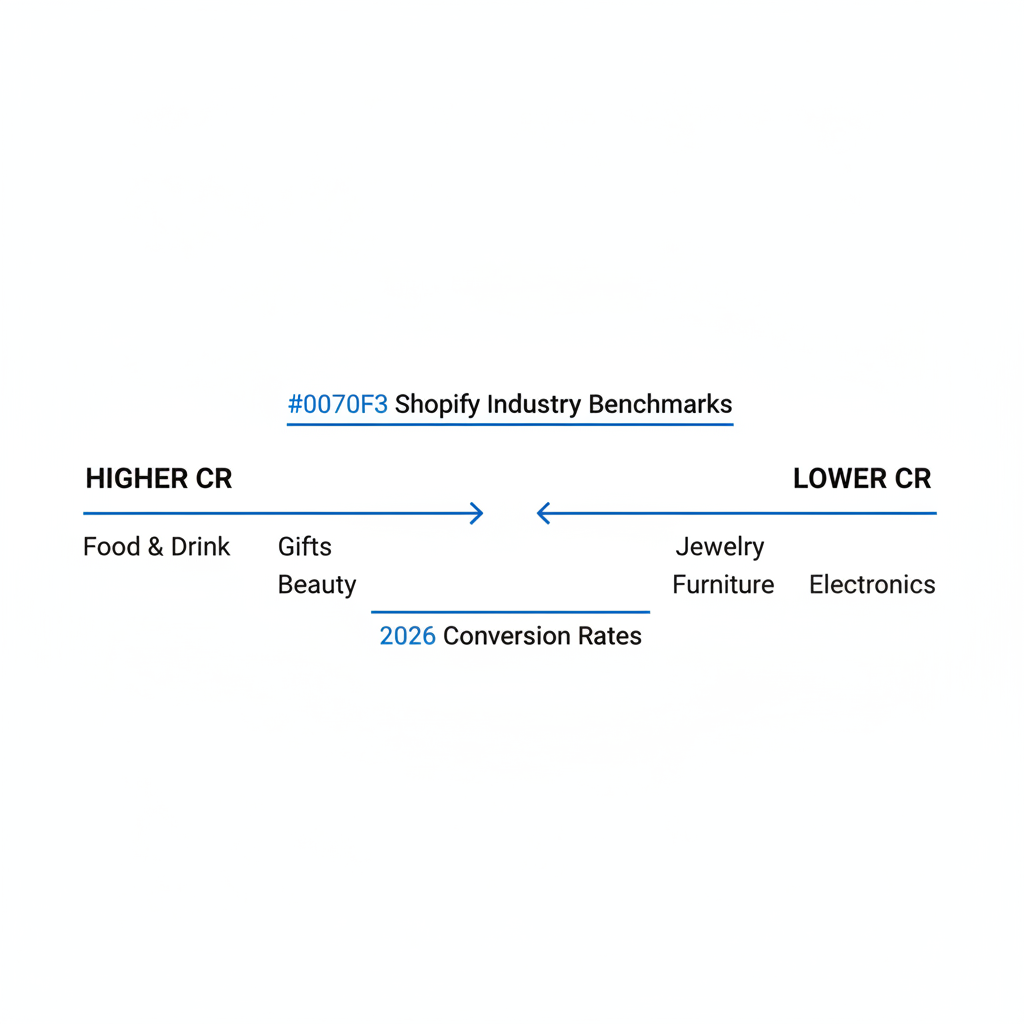
Shopify conversion rate benchmarks vary sharply by industry in 2026. Fast-repeat, lower-friction categories like food, gifts, and beauty convert much higher than considered-purchase categories like jewelry, furniture, and electronics.
In my experience building Shopify apps, this is where merchants get the most value from benchmark data. Once you know your category range, you can stop making bad comparisons and start prioritizing the right fixes.
| Industry | Average Conversion Rate | Top Performers | My Read |
|---|---|---|---|
| Food & Beverage | 4.2% to 6.22% | 6.8%+ | High intent, repeat purchases, low decision friction |
| Gifts & Specialty | 4.5% to 5.0% | 6.0%+ | Strong buyer intent, seasonal spikes, simpler decision paths |
| Beauty & Cosmetics | 3.2% to 4.9% | 5.2% to 6.0% | Strong repeat behavior and social proof impact |
| Health & Wellness | 3.0% to 3.4% | 5.0% to 5.5% | Trust and education matter, but intent can be high |
| Pet Supplies | 2.5% to 3.8% | 4.0% to 5.9% | Loyalty and replenishment help a lot |
| Fashion & Apparel | 1.6% to 3.1% | 3.6% to 4.5% | Heavy mobile traffic, sizing friction, return anxiety |
| Home & Garden | 2.0% to 2.5% | 3.4% to 3.5% | Moderate intent, often affected by AOV and shipping concerns |
| Electronics | 1.5% to 2.2% | N/A | Comparison shopping and technical research reduce conversion |
| Jewelry | 1.7% | 2.9% | High consideration, trust barriers, gifting and luxury dynamics |
For jewelry merchants specifically, category context matters a lot. If that is your niche, our post on the best apps for jewelry Shopify stores is worth a read because merchandising and trust signals have an outsized impact there.
Why does food and beverage convert so much higher?
Food and beverage converts higher because purchases are simpler, cheaper, and more repeatable. Shoppers usually understand the product quickly, feel less risk, and can reorder without much research.
I have seen this pattern repeatedly. Consumables benefit from lower AOV, clearer utility, and stronger repeat purchase behavior. A snack subscription or coffee reorder is a much easier yes than a $300 jacket or a $1,200 ring.
Why do jewelry, electronics, and fashion often convert lower?
These categories convert lower because they involve more hesitation. Buyers compare prices, worry about fit or authenticity, and spend longer researching before they purchase.
Fashion has size and returns friction. Electronics has spec comparisons and marketplace competition. Jewelry has trust, gifting pressure, and higher-ticket hesitation. In all three, product page quality matters more than average.
If your product page is the main bottleneck, I would also read our guide to improving Shopify product page conversion rate. That is often where category-specific gains happen fastest.
How should I compare my store to these benchmarks?
You should compare your store to benchmarks using segmented data, not one site-wide number. The best comparison includes industry, device, traffic source, new vs returning visitors, and price band.
This is the part most merchants skip. A store with a 1.9% overall conversion rate might actually be doing great on desktop and terribly on mobile. Or it may convert brilliantly on email traffic and poorly on paid social. Without segmentation, you cannot tell.
- Start with your total online store conversion rate in Shopify Analytics.
- Break it down by device to see whether mobile is dragging performance.
- Break it down by channel such as email, organic search, paid social, and direct.
- Compare new vs returning visitors because returning traffic usually converts higher.
- Review top product pages instead of only looking at site-wide averages.
- Compare against your category benchmark, not the platform average alone.
In my own app work, I usually care more about trend direction than a single monthly number. A store moving from 1.6% to 2.1% with cleaner traffic and better AOV is healthier than a store stuck at 2.4% with rising acquisition costs.
What factors affect Shopify conversion rates the most in 2026?
The biggest factors affecting Shopify conversion rates in 2026 are traffic quality, mobile UX, trust signals, page speed, and checkout friction. Industry still matters, but execution inside the store matters just as much.
When I test stores or review merchant setups, the same issues come up again and again. The benchmark gap is often not caused by one huge problem. It is usually caused by 5 to 10 smaller frictions stacking up across the journey.
How much does device mix matter?
Device mix matters a lot because desktop still converts materially better than mobile. In 2026, desktop often lands around 1.8% to 1.9%, while mobile is closer to 1.2% to 1.3%.
If 80% of your traffic is mobile, your benchmark should be lower than a desktop-heavy store. That does not mean accepting weak mobile UX. It means you should optimize with a realistic lens.
- Make add-to-cart buttons obvious above the fold
- Reduce pop-up overload on mobile
- Keep variant selection simple
- Use fast-loading images and compressed media
- Prioritize accelerated checkout methods like Shop Pay
How much do trust signals matter?
Trust signals matter most in categories with higher perceived risk. Reviews, shipping clarity, returns information, and visible contact options can materially improve conversion.
This is one reason review apps and post-purchase support apps keep performing well. Merchants underestimate how many buyers hesitate because they cannot quickly answer a simple question like delivery timing, returns policy, or product quality.
For reviews, I am obviously biased because I build apps in the Shopify ecosystem, but social proof is still one of the highest-leverage improvements for many stores. If you use a review platform, make sure ratings are visible on collection pages, product pages, and key landing pages.
How much does checkout optimization matter?
Checkout optimization matters because small reductions in friction can lift revenue without increasing traffic. A better checkout experience improves the percentage of shoppers who complete the purchase after showing intent.
Checkout is especially important when your add-to-cart rate is healthy but your purchase rate lags. If that sounds familiar, read our Shopify checkout guide. I would also look closely at payment methods, shipping surprises, and discount-code distraction.
How do I calculate my Shopify conversion rate correctly?
Your Shopify conversion rate is calculated as orders divided by sessions, multiplied by 100. The formula is simple, but the interpretation can be misleading if you do not account for channel mix and repeat visitors.
Here is the basic formula:
Conversion Rate = (Orders / Sessions) x 100
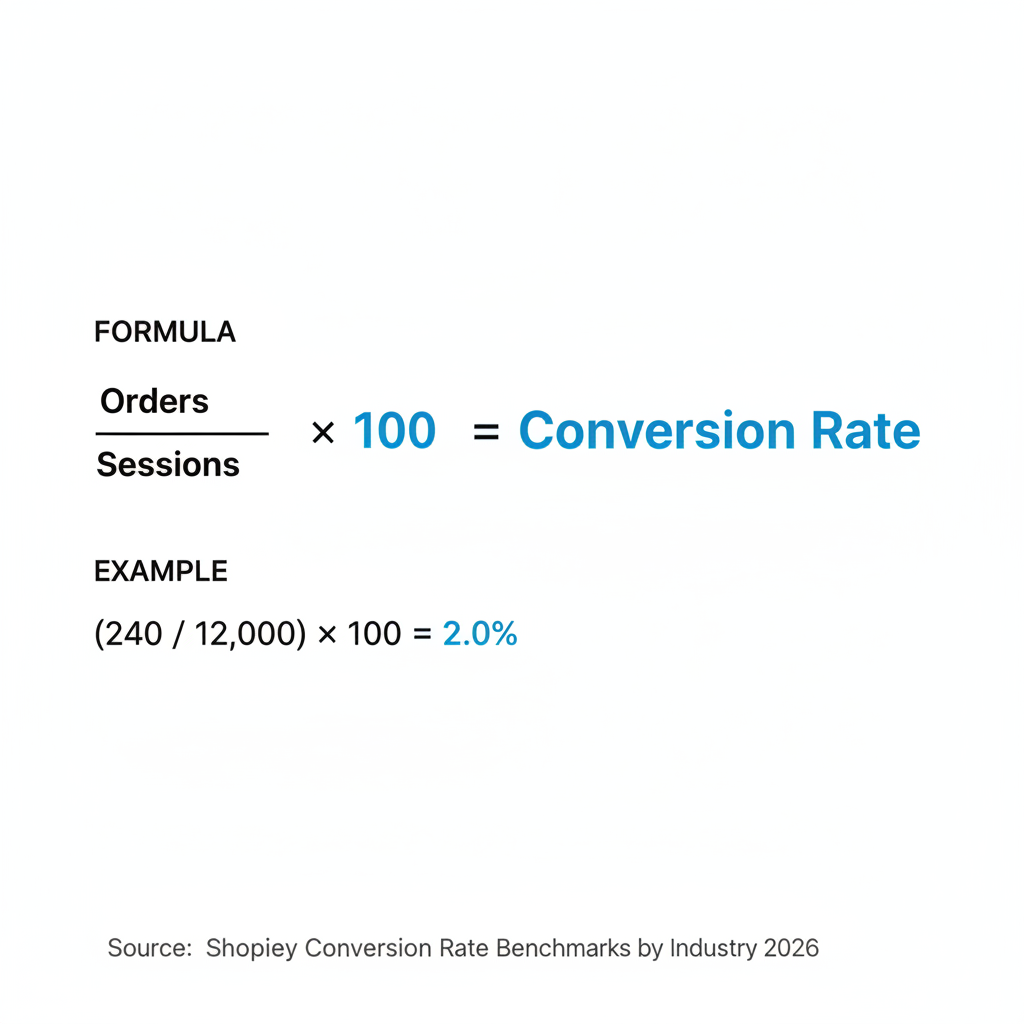
Example: if your store gets 12,000 sessions and generates 240 orders, your conversion rate is 2.0%.
That number is useful, but I never stop there. I also want to know:
- What percentage came from brand traffic versus cold traffic?
- What was the mobile conversion rate?
- Which landing pages had the highest exit rate?
- Did conversion improve or drop after a theme or app change?
- Was AOV increasing alongside conversion, or falling?
Shopify’s own resources on conversion rate and retail conversion math are useful starting points, including the main Shopify ecommerce conversion rate guide and Shopify's retail conversion rate explanation.
What should I do if my store is below my industry benchmark?
If your store is below benchmark, start by identifying the biggest point of friction in the funnel. Do not redesign everything at once. Find the one stage where shoppers are dropping off the hardest.
In my experience, merchants lose months by making broad visual changes instead of fixing measurable bottlenecks. A lower-than-average conversion rate usually comes from one of four places: bad traffic, weak product pages, poor mobile UX, or checkout friction.
-
Audit traffic quality
Check whether paid campaigns are bringing relevant visitors. Low-intent traffic can crush conversion rates even when the store is fine. -
Improve your top product pages first
Focus on bestsellers, not every SKU. Tighten headlines, imagery, social proof, FAQs, and shipping clarity. -
Reduce mobile friction
Test the full purchase flow on your own phone. Many merchants are surprised by how annoying their own store feels on mobile. -
Review cart and checkout drop-off
Unexpected shipping fees, coupon hunting, and account creation prompts still kill conversions. -
Test upsells carefully
Upsells can increase revenue, but poorly timed ones can hurt completion rate. The goal is a higher revenue per visitor, not just more pop-ups.
For stores trying to raise revenue without raising ad spend, our article on how to increase average order value on Shopify pairs well with this one. A higher conversion rate and a higher AOV compound really fast.
If you are experimenting with upsells, I would also look at these upsell statistics and our Shopify upsell case study. In practice, a store does not need to win on conversion rate alone if it also improves cart value efficiently.
Which apps can help improve Shopify conversion rates?
The best apps for improving Shopify conversion rates are the ones that reduce friction or increase buyer confidence. That usually means review apps, upsell apps, support tools, and testing tools.
As someone who builds Shopify apps, I have a simple rule here: install fewer apps, but make sure each one solves a specific conversion problem. App bloat can easily cancel out the gains if it slows the site or creates interface clutter.
- Product review apps on the Shopify App Store - best for trust and social proof
- Upsell apps on the Shopify App Store - best for increasing revenue per visitor
- FAQ and support apps - best for reducing hesitation
- A/B testing apps - best for validating changes instead of guessing
- Delivery and shipping timer apps - best for urgency and delivery clarity
On LaunchTip, I cover a lot of these categories because they directly affect conversion outcomes. If you want a more systematic testing approach, our post on continuous A/B testing frameworks for Shopify is a good next step.
What benchmark should new Shopify stores aim for first?
New Shopify stores should aim for 1.5% to 2.5% first, then optimize toward category-specific benchmarks. Early-stage stores usually need to fix traffic quality and product page clarity before chasing elite conversion numbers.
I think this matters because new merchants often get discouraged by seeing benchmark tables with 4%+ results. Those stores usually have stronger brand recognition, better retention, cleaner merchandising, and more refined acquisition. A newer store should focus on building a stable baseline.
My practical milestones for a newer store would be:
- 0.8% to 1.2% - fix obvious trust and traffic issues
- 1.2% to 2.0% - improve product page clarity and mobile UX
- 2.0% to 3.0% - optimize checkout, social proof, and merchandising
- 3.0%+ - start deeper testing by segment, offer, and landing page
If you are still in the setup phase, our Shopify store launch checklist can help prevent a lot of the common mistakes that suppress conversion from day one.
Which sources are useful for tracking Shopify conversion rate benchmarks?
The most useful sources are Shopify’s own content, specialized CRO agencies, and benchmark roundups that separate industry data from platform averages. The key is to use multiple sources and look for consensus ranges rather than one magic number.
For this topic, I would keep an eye on:
- Shopify's ecommerce conversion rate guide
- Blend Commerce benchmark analysis
- Growth Suite's industry benchmark guide
- Easy Apps Ecommerce benchmark roundup
- Uptek's Shopify conversion rate statistics
- Red Stag Fulfillment benchmark discussion
What I like about comparing several sources is that patterns become obvious quickly. Even when exact numbers differ, most credible sources cluster around the same reality: Shopify-wide averages are modest, industry matters a lot, and top-performing stores are usually 2x to 3x above average.
How do I use Shopify conversion rate statistics 2026 without misreading them?
The right way to use Shopify conversion rate statistics 2026 is as context, not as a verdict. Benchmarks should guide your diagnosis, but they should never replace store-specific analysis.
If I had to leave you with one practical takeaway, it would be this: compare your store against the right peer group, then improve one bottleneck at a time. A benchmark table can tell you whether you are behind. It cannot tell you whether your real problem is traffic quality, mobile UX, pricing confidence, or checkout friction.
That is why the best merchants I have worked with do not obsess over a single number. They track conversion rate, yes, but they also watch add-to-cart rate, checkout completion, AOV, and revenue per visitor. That is how you turn benchmark data into actual growth.