Shopify print on demand statistics 2026 show a market that is still growing fast, but it is also getting more competitive. In practical terms, that means Shopify merchants can still build profitable POD stores, but the stores that win in 2026 are the ones that understand revenue benchmarks, margin targets, and conversion economics instead of relying on guesswork.
As a Shopify app developer, I spend a lot of time looking at how merchants actually monetize traffic, improve average order value, and reduce drop-off. In my experience building Shopify apps and working with merchants across different niches, print on demand is still one of the easiest ways to launch, but it is not a shortcut to easy revenue. The numbers matter more than ever.
In this guide, I will break down the most useful stats for Shopify sellers in 2026, explain what the benchmarks actually mean, and show how I would use them if I were launching or scaling a POD brand today. I will also point out where the published figures disagree, because not every market size estimate is measuring the same thing.
What are the most important Shopify print on demand statistics in 2026?
The most important Shopify print on demand statistics in 2026 are that the global POD market is estimated at $8 billion to $15.19 billion, around 13% of Shopify stores use POD apps, and average product margins usually fall between 20% and 50%. Apparel still dominates, while top-performing stores grow faster by increasing listings, improving conversion rate, and lifting AOV with bundles and upsells.
Here are the headline numbers I think merchants should care about most:
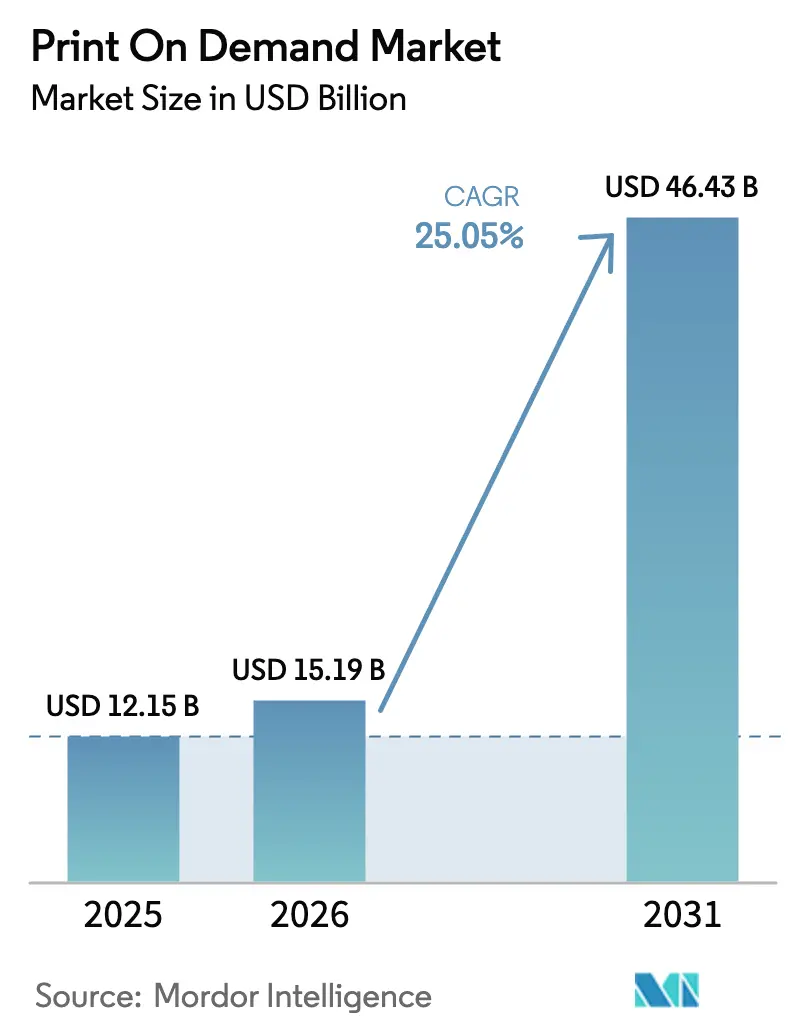
- Global POD market size: roughly $8B to $15.19B in 2026, depending on methodology and source
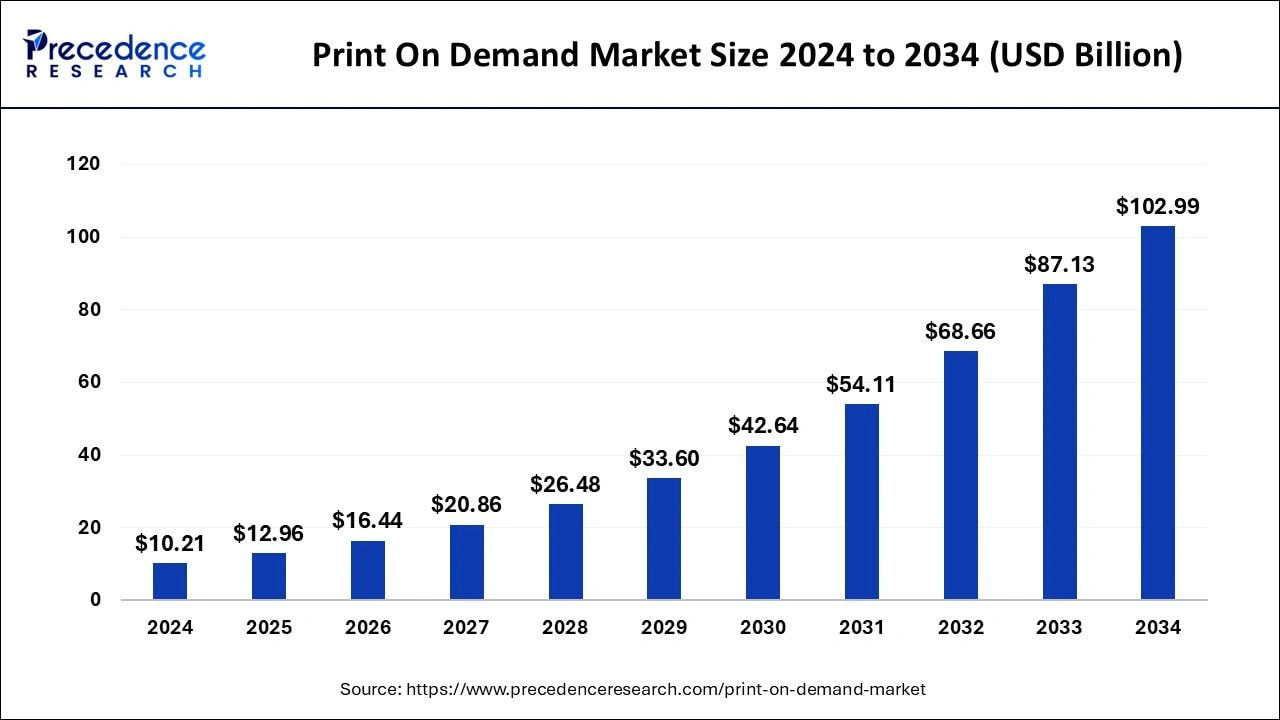
- Projected growth: commonly cited at 25%+ CAGR through 2030 or 2031
- Shopify POD adoption: about 13% of Shopify stores, or 368,000+ active stores
- U.S. market share: about 35% to 36% of global POD revenue
- Shopify share of U.S. POD transactions: about 62%
- Average time to first $1,000 in revenue: around 165 days
- Faster sellers reach $1,000 in under 118 days by publishing consistently
- Typical POD margins: 20% to 50%, depending on product and pricing power
- Q4 contribution: often around 40% of annual sales
- Mobile traffic share: usually 60%+
If you are still validating your business model, I would treat these as planning benchmarks, not guarantees. They are useful for setting targets, especially if you are comparing POD against other business models like digital products or in-house production.
How big is the print on demand market in 2026?
The print on demand market in 2026 is large and still expanding quickly, with credible estimates ranging from $8 billion to $15.19 billion. The variation comes from different definitions of POD, geography, and whether analysts include adjacent custom-printing segments.
This is one of the biggest issues I see when merchants quote industry stats. A blog post may say the market is $8B, another says $15B, and both can be directionally correct because they are measuring slightly different slices of the same industry.
| Source type | 2026 estimate | Growth outlook | How I interpret it |
|---|---|---|---|
| Conservative industry estimate | $8B | 25% to 30% CAGR | Useful for cautious planning |
| Mordor Intelligence cited widely by POD brands | $15.19B | $46.43B by 2031 | Best-known mainstream benchmark |
| Alternative market research estimates | $12.96B to $13.06B | About 26% CAGR | Supports the same growth direction |
For Shopify merchants, the exact market size matters less than the pattern. The pattern is clear: POD demand is growing, personalization is mainstream, and Shopify remains a major operating system for POD brands.
If you are comparing business models, this is also why POD is still attractive for new sellers. You can validate demand without buying inventory up front, then move into hybrid fulfillment later if margins justify it. I covered that transition in more detail in From Pure POD to In-House Printing: A Shopify Merchant's Guide to the Hybrid Fulfilment Model.
Why do market size estimates vary so much?
Market size estimates vary because researchers use different product scopes, regions, and reporting models. Some studies focus on pure ecommerce POD, while others include broader custom printing or B2B fulfillment segments.
My advice is simple: use platform-specific data when you are making Shopify decisions. For example, Printify and Printful often publish more useful merchant-level benchmarks than broad market reports, because they can see actual seller behavior.
How many Shopify stores use print on demand in 2026?
In 2026, about 13% of Shopify stores are estimated to use print on demand apps, which works out to 368,000+ active stores. That is a huge installed base, and it confirms that POD is no longer a niche side hustle model.
From a Shopify ecosystem perspective, this number is significant. It tells me two things. First, there is still strong merchant demand for POD. Second, competition is intense in generic niches, so positioning and differentiation matter more than store setup.
Shopify is also estimated to handle around 62% of U.S. POD transactions. That is one of the strongest indicators that Shopify remains the default platform for serious independent POD brands rather than just marketplace sellers.

| Metric | 2026 benchmark | What it means for merchants |
|---|---|---|
| Share of Shopify stores using POD | 13% | POD is mainstream on Shopify |
| Estimated active Shopify POD stores | 368,000+ | You need a niche, not a generic catalog |
| Shopify share of U.S. POD transactions | 62% | Shopify is a dominant POD commerce platform |
If you are just starting, I would not read this as a reason to avoid POD. I would read it as a reason to avoid launching another store with vague motivational shirts and no audience angle.
If you need help choosing a niche that can work on Shopify, my post on 20 Niche Online Business Ideas to Start on Shopify in 2026 is a good place to start.
What revenue benchmarks should Shopify POD merchants use in 2026?
The best revenue benchmarks for Shopify POD merchants in 2026 are time-to-first-$1K, listings published, conversion efficiency, and average order value. Revenue by itself is a vanity metric unless you connect it to traffic, margin, and repeatability.
One of the most useful benchmarks published this year is that the average seller takes about 165 days to reach their first $1,000 in revenue. Better-optimized sellers can do it in under 118 days, often by publishing 10 new listings per week and launching 67 or more designs.
That lines up with what I have seen across Shopify more broadly. Stores that treat product publishing as a consistent operating rhythm usually outperform stores that launch 12 products and then wait for ads to save them.
| Revenue benchmark | Typical seller | Stronger seller |
|---|---|---|
| Time to first $1,000 revenue | 165 days | Under 118 days |
| New listings published | Inconsistent | 10 per week |
| Design volume before traction | Low catalog depth | 67+ designs |
| Catalog size for top performers | Under 100 listings | 500+ listings |
There is an important lesson here. In POD, revenue usually compounds from catalog depth, niche fit, and conversion improvements, not from finding one magical winning product.

What is a realistic monthly revenue target for a new POD store?
A realistic monthly revenue target for a new POD store is usually modest at first, often under $1,000 per month in the early stages unless the merchant already has traffic or an audience. The more useful goal is to reach repeatable sales with acceptable margins.
In my experience, new merchants often ask the wrong question. They ask, "How much can I make?" when they should ask, "How many profitable orders can I generate consistently?" A store doing $3,000 a month at weak margins and high ad costs is in a worse position than a store doing $1,500 with healthy contribution margin.
For broader Shopify context, this is similar to what you see in general store performance data. If you want a wider benchmark beyond POD, general Shopify revenue distributions show that most new stores stay small until they improve product-market fit and conversion.
What are average print on demand profit margins on Shopify?
Average print on demand profit margins on Shopify usually range from 20% to 50%, depending on product type, shipping profile, and brand strength. Commodity apparel tends to sit toward the lower end, while accessories and giftable items often carry better margins.
As a rule, I think merchants should aim for 40%+ gross margin where possible, especially if they plan to run paid ads. Once you account for Shopify fees, payment fees, app costs, returns, discounts, and customer acquisition, thin margins disappear fast.
| Product | Revenue or order share | Average margin | My take |
|---|---|---|---|
| T-shirts | 40% to 60% of orders | 25% to 35% | Easy to launch, harder to defend |
| Hoodies | 15% | 30% to 45% | Better AOV and gifting potential |
| Mugs | 12% | 40% to 55%, sometimes up to 76% | Excellent margin if shipping works |
| Phone cases | 8% | 35% to 50% | Good impulse-buy economics |
A common example is a hoodie sold for $44.99 with a base cost of $18, shipping of $6, and roughly $2 in fees, leaving about $18 profit. That works out to roughly a 40% margin, which is healthy enough to support discounts or paid acquisition.

If you are selling low-priced t-shirts with weak differentiation, the margin math gets much tougher. That is one reason I often prefer merchants to add higher-margin accessories, bundles, or premium variants rather than building the whole store around basic tees.
Which POD products have the best margins in 2026?
The best-margin POD products in 2026 are usually mugs, phone cases, premium hoodies, and niche gift items with strong perceived value. T-shirts still sell the most volume, but they are often the hardest category to protect on price.
In practice, the best product is not just the one with the highest raw margin. It is the one with the best combination of conversion rate, low return risk, reasonable shipping costs, and repeatable creative angle.
If you are building around apparel, I recommend reading 12 Best Shopify Apps for Selling Custom Clothing Products in 2026. If you are exploring giftable or seasonal formats, my post on Print-On-Demand Calendars for Shopify: Which Apps Actually Offer Them in 2026? may also help.
What products drive the most POD revenue on Shopify?
Apparel drives the most POD revenue on Shopify, accounting for roughly 60% of total category revenue. Within apparel, t-shirts remain the largest single product type, often making up 40% to 60% of order volume.
This is not surprising. Apparel is easy to merchandise, easy to personalize, and familiar to customers. But it is also where I see the most saturation, especially for stores that rely on generic slogans and broad-interest designs.
- Apparel: about 60% of POD revenue
- T-shirts: about 40% to 60% of orders
- Hoodies: about 15% of volume
- Mugs: about 12%
- Phone cases: about 8%
The opportunity is not to avoid apparel entirely. The opportunity is to use apparel as the traffic driver, then improve basket size with complementary products. That is where upselling and cross-selling become very important.
For stores that want to improve AOV, I have written separately about Upsell Statistics in E-Commerce: Key Statistics and Data for 2026. The same logic applies to POD: one extra item in the cart can transform a marginal order into a profitable one.
How do top Shopify POD stores outperform average stores?
Top Shopify POD stores outperform average stores by publishing more products, simplifying product choices, optimizing mobile conversion, and increasing average order value. They win on systems, not luck.
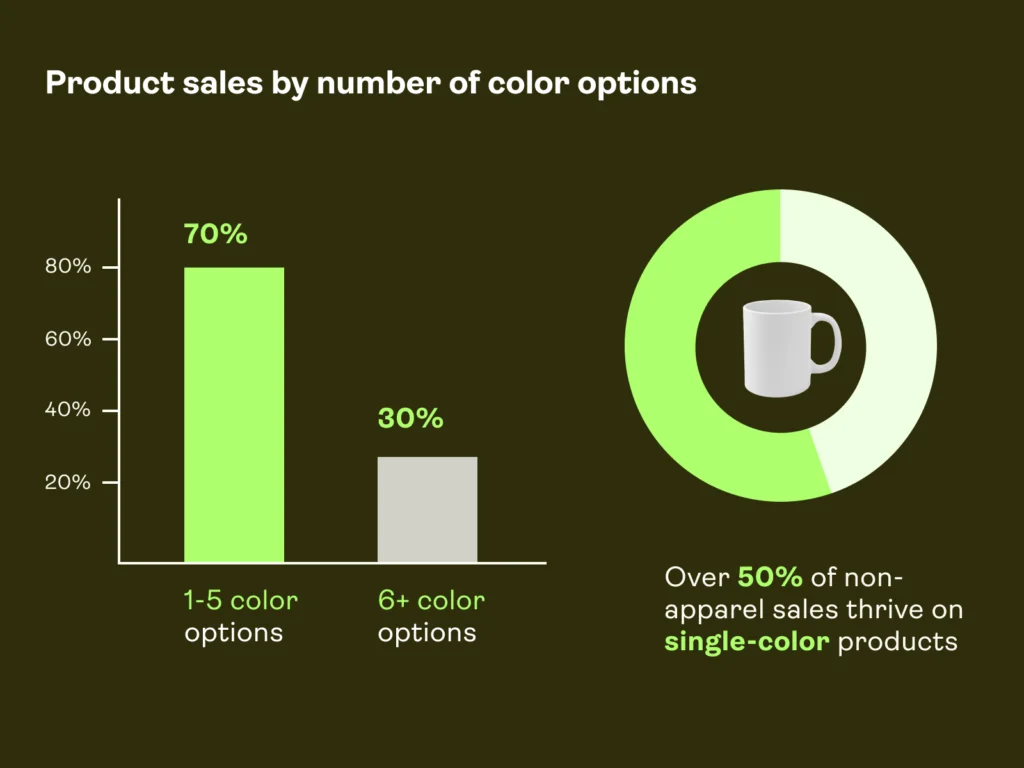
One stat I find especially useful is that simpler products often sell better. According to published platform data, products with 1 to 2 design elements and 1 to 5 color options can outperform more complex variants by around 70%. That makes sense because too many choices create friction.
In my own testing across Shopify stores, reducing decision fatigue almost always helps. Fewer variant choices, clearer product pages, better social proof, and a stronger add-on flow usually beat the "more options is better" approach.
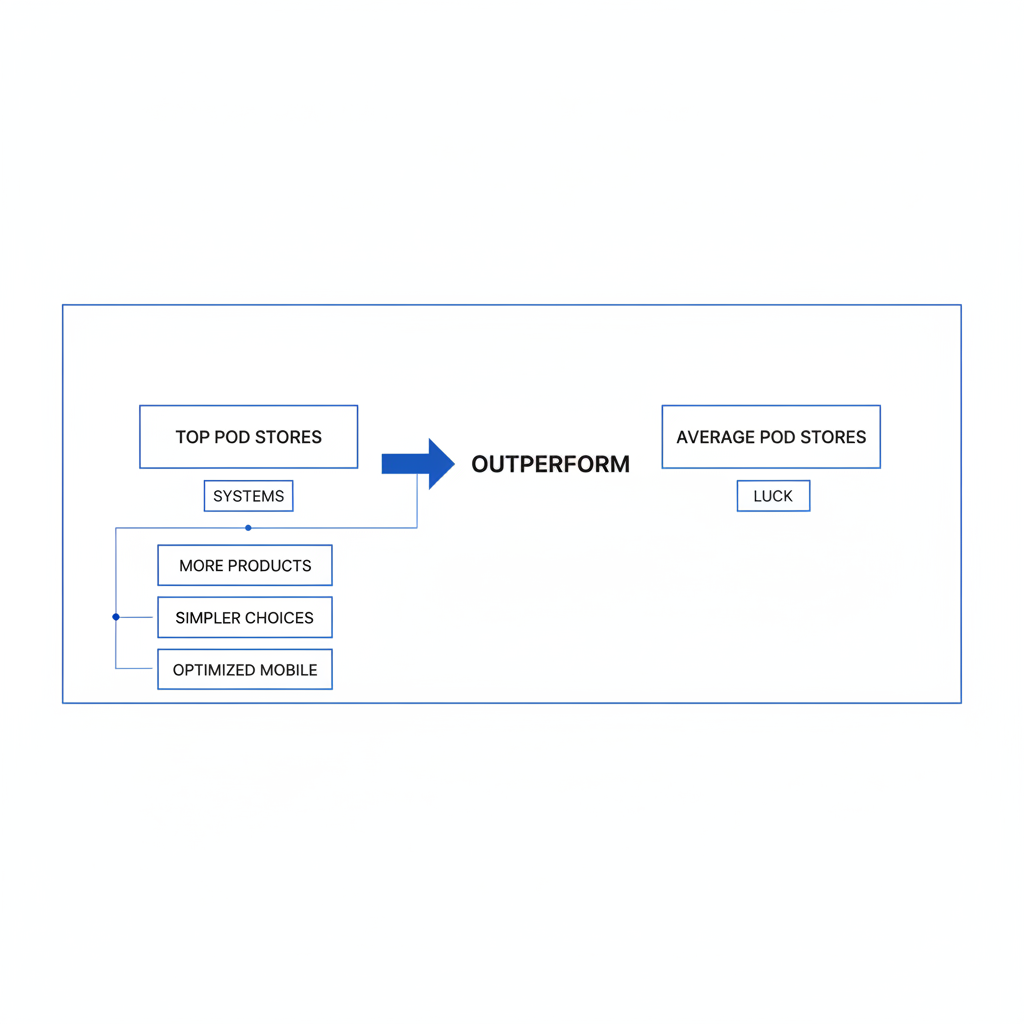
- They publish consistently. Top sellers often add 10 new listings per week.
- They build larger catalogs. Many strong stores reach 500+ listings.
- They simplify product pages. Fewer design elements and fewer color choices can convert better.
- They optimize for mobile. Mobile often accounts for 60%+ of traffic.
- They increase AOV. Upsells and bundles can lift order value by 20% to 35%.
If I were auditing a POD store today, I would check mobile PDP speed, image quality, trust signals, shipping clarity, and post-add-to-cart upsells before I worried about redesigning the whole brand.
That is also where apps can help. For example, my own app SellUp is built specifically around Shopify upsells and can help merchants present relevant offers after the add-to-cart event. You can find it on the Shopify App Store here: SellUp.
What seasonal and customer behavior stats matter most for 2026?
The most important seasonal and customer behavior stats for POD in 2026 are that Q4 can drive about 40% of annual sales, 81% of customers prefer personalized products, and mobile traffic exceeds 60% for many stores. These numbers affect how you plan inventory-free product launches, promotions, and landing pages.
Seasonality is especially important in POD because gifting, events, and identity-based purchases are such a big part of demand. If you ignore Q4, back-to-school, graduation, or niche-specific seasonal moments, you are leaving revenue on the table.
| Behavior trend | Benchmark | Why it matters |
|---|---|---|
| Personalization preference | 81% of customers | Custom products remain highly attractive |
| Q4 sales concentration | 40% of annual sales | Holiday prep can make or break the year |
| Mobile traffic share | 60%+ | Mobile UX directly affects revenue |
For many merchants, the best move is to build a simple annual calendar. Plan niche launches, gifting collections, email pushes, and bundle offers around those demand peaks. POD gives you flexibility, but that flexibility only pays off if you use it intentionally.
Which apps and tools matter most for POD revenue growth on Shopify?
The apps and tools that matter most for POD revenue growth on Shopify are your fulfillment connector, product reviews, upsell tools, and customer support utilities. The biggest gains usually come from improving conversion and order value, not from adding more software.
For fulfillment, the two biggest names are still Printful and Printify. Both have extensive product catalogs and established Shopify workflows. If you are comparing providers more broadly, I also recommend our guide to 8 Best Print-on-Demand Providers in 2026: Comparison for Shopify Sellers.
For social proof, reviews matter a lot on POD product pages because buyers often worry about print quality, shipping times, and fit. My own app Lumo Reviews is built for collecting and displaying reviews on Shopify, and you can check it out here: Lumo Reviews.

For customer questions, especially around personalization and shipping expectations, a support layer helps reduce pre-purchase hesitation. My app NoteDesk is designed for customer messaging and store notes, and it is available here: NoteDesk.
| Use case | Recommended app | Why it matters |
|---|---|---|
| Fulfillment | Printful | Reliable POD production and shipping integrations |
| Fulfillment | Printify | Large supplier network and wide product range |
| Upsells | SellUp | Can help lift AOV with relevant offers |
| Reviews | Lumo Reviews | Builds trust on product pages |
| Support and notes | NoteDesk | Helps clarify custom orders and customer questions |
I am obviously close to the app side of Shopify, so I always tell merchants the same thing: install fewer apps, but make sure each one solves a real revenue problem.
How should Shopify merchants use these POD statistics in practice?
Shopify merchants should use POD statistics in practice to set realistic targets, choose better products, and improve unit economics. The numbers are most useful when they shape decisions about catalog size, pricing, AOV, and seasonal planning.
If I were launching a POD store in 2026, this is the framework I would use:
- Pick a narrow niche. Avoid broad, generic designs.
- Start with a margin-aware catalog. Use tees for reach, but include hoodies, mugs, or accessories for better economics.
- Aim for 40%+ gross margin. If your model cannot support that, pricing or product choice needs work.
- Publish consistently. Treat new listings as a weekly operating habit.
- Optimize mobile first. Most of your traffic will likely come from phones.
- Increase AOV early. Add bundles, related products, and post-add-to-cart offers.
- Plan for Q4 months in advance. Holiday sales are too important to improvise.
That is really the core lesson from the 2026 data. The stores that do well are not just creative. They are operationally disciplined.
If you are still in the setup phase, these LaunchTip guides may help next: Build Your Print on Demand Business with Shopify in 2026: Step-by-Step Guide and How to Start a Print on Demand Business with Shopify: Step by Step Guide for 2026.
What is my verdict on Shopify print on demand in 2026?
My verdict is that Shopify print on demand in 2026 is still a strong business model, but it rewards operators more than hobbyists. The data supports the opportunity, but it also shows that catalog depth, margin discipline, and conversion optimization are what separate profitable stores from stalled ones.
In my experience building Shopify apps, the merchants who last are the ones who treat POD like a real ecommerce business. They track numbers, test offers, improve product pages, and keep shipping expectations clear. That is much less exciting than viral success stories, but it is how durable revenue gets built.
For further reading and source material, I recommend checking the original reports from Printify, Printful, and broader market research from Mordor Intelligence. If you want a useful competitor reference, you can also see how others are presenting this topic at Easy Apps Ecom.